"The True Employment Rate" (TRU) for Black People in the Labor Force is 27.3%, Nearly 5X What BLS Reported. Only 5 Out of 10 Blacks have a Full Time Job Earning More than $20k Year- According to LISEP
/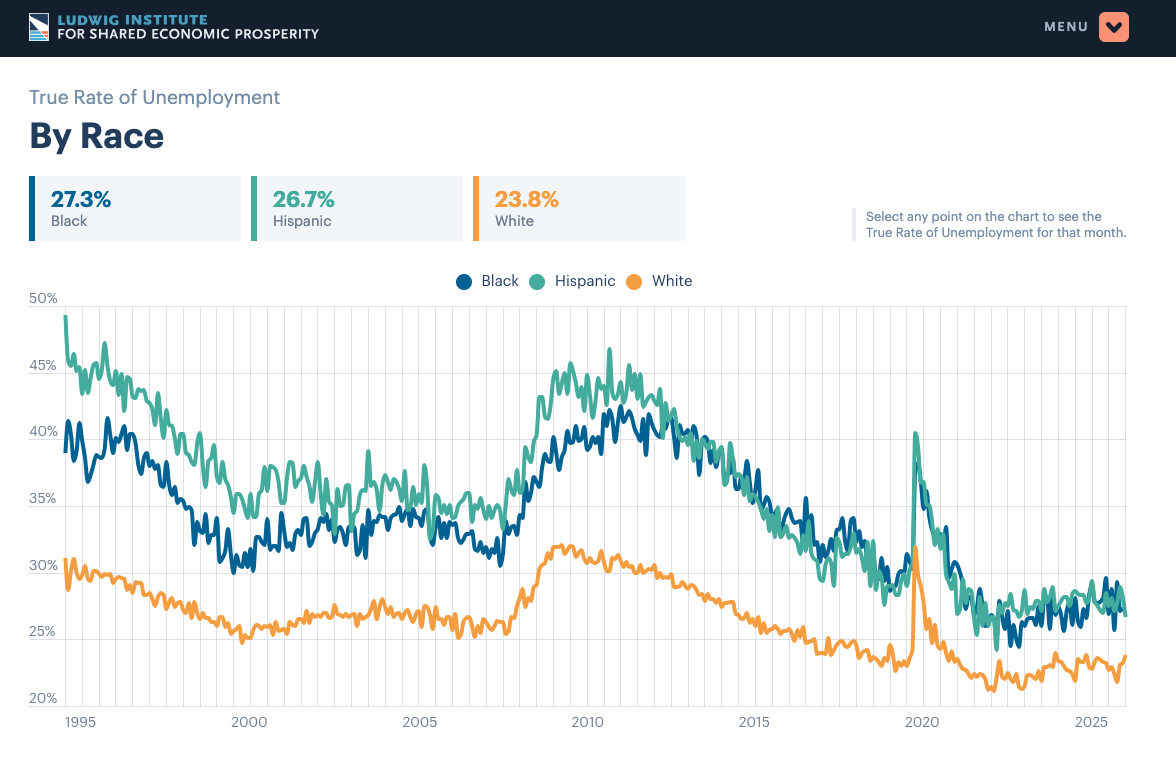
According to the LUDWIG Institute, The True Rate of Unemployment (TRU), as defined by LISEP, measures the percentage of the U.S. labor force that is functionally unemployed.
Using data compiled by the federal government’s Bureau of Labor Statistics, the True Rate of Unemployment tracks the percentage of the U.S. labor force that does not have a full-time job (35+ hours a week) but wants one, has no job, or does not earn a living wage, conservatively pegged at $26,000 (in 2025 dollars) annually before taxes.
Just as an accurate census is a prerequisite to funding American communities equitably, policymakers depend on economic indicators to shape economic policy. LISEP developed the True Rate of Unemployment to provide analysts and decision-makers with a more accurate measure of Americans’ financial well-being.
Measuring Better: Development of ‘True Rate of Unemployment’ Data as the Basis for Social and Economic Policy
By The Ludwig Institute for Shared Economic Prosperity (LISEP)
From [LISEP] For decades, the development and implementation of social and economic policy at the federal, state, and local level has largely relied on a collection of economic indicators that includes, among others, gross domestic product (GDP), consumer price index (CPI), and one of the most closely watched measures – the unemployment rate. Generally speaking, the unemployment rate is calculated by simply dividing the number of unemployed persons – as defined by the U.S. Bureau of Labor Statistics (BLS) – by the number of persons in the labor force (employed or unemployed who are actively seeking employment) and multiplying by 100. While this measure may be elegant in its simplicity, it presents a very incomplete and, in many ways, misleading picture.
The years following the Great Recession of 2008 – up until the onset of the coronavirus pandemic – technically represented the longest period of economic expansion in the nation’s history by traditional economic measures. Yet anecdotally, it is easy to find examples throughout the nation of many communities that did not share in this prosperity. One need look no further than struggling industrial communities around the country – cities like York, Pa., Flint, Mich., or Albany, Ga., for example – that were thriving in the 1970s, but have now been forgotten by cosmopolitan America. And it’s not just smaller, rural cities; even in pockets of the most prosperous cities in America, working- and middle-class families are struggling to keep their heads above water. This lends rise to the question: How was this economic expansion happening without anyone in these communities seeing any benefit?
The answer lies, in large part, with the development and subsequent implementation of government economic policy. Almost without fail, whatever economic policies have been emerging from government, the underlying reality is an unacceptable outcome for a vast portion of the population. By some measure, those who have neglected the plight of working- and middle-class America should be given a pass. After all, the indicators used to gauge whether things are headed in the right direction measure only a sliver of what really matters. In a world of increasing data sophistication and economic disparity, the broadly accepted standards of measurement – from GDP to the stock market to unemployment figures – overlook what is happening in places like York, Flint, and Albany, let alone other discrete areas of economic deprivation. Yet those are the conventional ways we gauge the economy’s health from month-to-month, and year-to-year. You can’t overstate how the prism through which we view the economy affects the choices businesses and policymakers make about how to shape the future.
This continued dependence on aggregate U.S. economic data constructed for a bygone era has been clouding the basic understanding of what’s happening on the ground. New measures are needed if we are to understand what’s really going on. And new solutions to achieve meaningfully remunerative employment are essential.
The Ludwig Institute for Shared Economic Prosperity (LISEP) seeks to address these challenges, beginning with an in-depth analysis of the labor market through the creation of a statistic to better convey the quality of employment of the nation’s workforce. This statistic, known as “True Rate of Unemployment” (TRU), can serve as a tool for policymakers to better measure the state of the labor force and appropriately formulate policy and direct resources. True Unemployment essentially corrects the unemployment rate by preventing bad jobs and part- time jobs from looking better than they are on paper – something that the BLS unemployment rate fails to do.
Methodology
LISEP’s data were derived from the Current Population Survey conducted by the BLS, which is used to generate its U-3 unemployment rate. This helps to ensure an “apples-to-apples” comparison between LISEP’s “True Rate of Unemployment” and “True Rate of Unemployment Out of the Population” described below, with the much relied upon BLS unemployment rate and employment to population ratio. LISEP’s definition of “True” employment or unemployment accepts the U-3 rate for comparison purposes, but modifies it by adopting two important stipulations. The first stipulation deals with the workweek. To be employed for the purposes of LISEP’s true employment concept, an individual must either have a full-time job (35+ hours per week) or have a part-time job but no desire to be full-time (e.g., students). The second stipulation is that an individual must earn at least $20,000 annually. This annual wage is adjusted for inflation, calculated in January 2020 dollars. ($20,000 was chosen because LISEP concluded that anything beneath that wage could fairly be considered a poverty wage, based on the U.S. poverty guidelines put out by the Department of Health and Human Services, which considers a three-person household to be in poverty if it has an income of less than $20,000 per year).
Specifically, LISEP employs the Current Population Survey’s Outgoing Rotational Group Study, a study that takes one-fourth of the survey respondents to ask specific questions about their wages. This dataset is merged with the Annual Social and Economic Supplement to account for the self-employed workforce. Using the self-employed wage and business income, and the rest of the labor force wage and bonus (overtime and tips) income, the final number reflects the amount of the labor force – defined by the BLS as people actively looking for work within the last four weeks – that is truly employed.
Furthermore, LISEP calculates the “True Rate of Unemployment Out of Population,” using the same statistical definition of True Rate of Employment, but instead taking this number from the entire working-age population (aged 16+) rather than the BLS-defined labor force.
Inadequacies of BLS Unemployment Measures
LISEP’s findings indicate a radical underreporting in the percentage of the population that is described as unemployed, from a living wage/full-time employment perspective. Although not technically false, the low rate reported by the BLS is deceiving, considering the proportion of people who are categorized as technically employed, but are employed on poverty-like wages (below $20,000 a year) and/or on a reduced workweek that they do not want. Neither of these factors is conducive to prospering, nor to providing for a family.
LISEP’s True Rate of Unemployment measure is very revealing. For example, LISEP estimates that in January 2020, True Rate of Unemployment was 23.5 percent, which is nearly seven times what was reported by the BLS (3.6 percent). The economic recession spurred by the coronavirus pandemic worsened the True Rate of Unemployment to 32.6 percent in April. This significant increase in the True Rate of Unemployment compared to the BLS-reported unemployment rate indicates the fragility of the workers’ situation that the BLS reports as employed. In the pandemic, the unemployment rate tripled, while the True Rate of Unemployment rate only increased 9 percent, showing that the majority of the displaced workforce was part-time or low-wage workers – the first to lose a job in a recession.
Measuring Issues of Inequality
The pain has not been spread evenly. Black Americans, marginalized for hundreds of years in America, are still burdened by challenges that dramatically narrow their economic base and deplete their opportunities to live the American Dream. And that’s as true in East New York and on the South Side of Chicago as it is in York, Flint, and Albany.
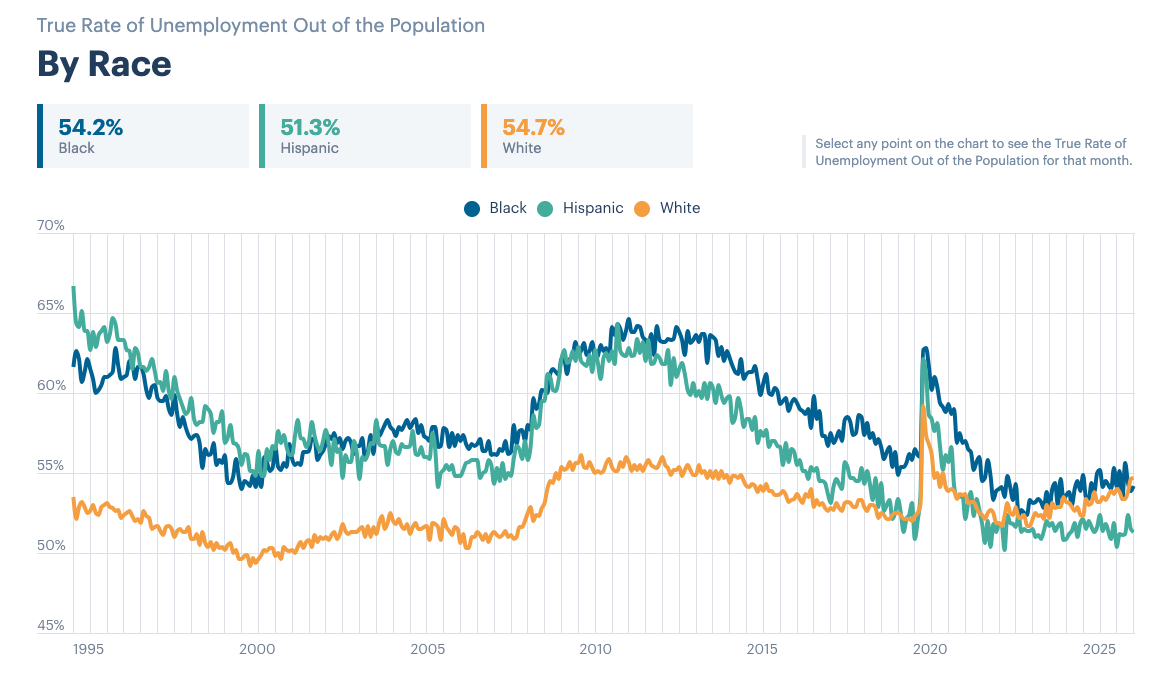
Not only can we see the disparity of recessionary causes in the type of workforce (part-time and lower-income workers have become increasingly represented), but it is also transparent in the racial breakdown of the True Rate of Unemployment. Not only is the Black True Rate of Unemployment higher every single month since 1995 than its White equivalent, but Black Americans are also more negatively impacted by and recover more slowly from recessions. For example, during COVID, the True Rate of Unemployment thus far peaked in April. Black True Rate of Unemployment in April was 34.8 percent, whereas the White True Rate of Unemployment was 30.7 percent. By October, the White True Rate of Unemployment had recovered to 22.9 percent. Meanwhile, the Black True Rate of Unemployment in October was 31.1 percent and the Hispanic rate sits at 31.9 percent -- both nearly 10 percent higher than their White equivalent. The bounce back in unemployment hasn’t been colorblind.
If this were not disturbing enough, out of the entire population (aged 16+), the numbers are staggering. If you consider the whole population instead of just the labor force, the rate for the entire population in October was 54.1 percent. But for the Black American population, the rate is 58.2 percent, nearly 5 percent higher. This means that only four out of 10 Black adults had a fulltime job that earned more than $20,000 per year.
The educational divide has also been exacerbated by the COVID crisis. Furthermore, recovery among different levels of education has not been equal. The TRU for those with advanced degrees in October was 13.1 percent, only slightly higher than its January level of 12.4 percent. Meanwhile, at the other end of the spectrum, those with lower educational levels have struggled. In January, the TRU for those with less than a high school education was 45 percent, but has grown progressively worse through the pandemic, with a rate of 50.2 percent for October.
Consequences of Inadequate Data
National statistics throughout the post-Great Recession expansion advanced the prevailing narrative that everything was going well in America, and indeed getting better. Specifically, political leaders and policymakers alike have pointed to GDP and the unemployment rate as proof of a thriving nation.
But these two so oft-cited and relied-upon headline statistics that have driven narratives espoused by political and economic thought leaders are juxtaposed to the tangible reality of dying industrial towns, burned out inner-cities, opioid-infested rural areas, and we could go on. These misleading statistics have also led policymakers down the path of pursuing sub-optimal policies.
This lack of accurate information does not just have an impact on how the average citizen perceives the economy: Policymakers and political leaders make crucial decisions using this information. By continuing to use inaccurate or misleading indicators about the economic health of the nation, the result will be inadequate, and possibly injurious, economic policy. For instance, if policy is developed based on what is perceived as “full employment,” livable-wage job creation initiatives will be curtailed. Indeed, simple domestic job creation will be curtailed for fear of bumping up against labor market constraints. And meanwhile, millions of Americans will continue to be relegated to sub-par, part-time work situations that challenge their ability to provide for themselves or a family.
The wealth gap is widening, and COVID is exacerbating a pre-existing bad situation for low- and moderate-income Americans. Just as an accurate census is needed to properly fund ommunities, accurate economic indicators are required to tell the true story of Americans’ well-being. Without it, policymakers will be unable to know where to focus their efforts.
Conclusion
The headline data currently being used to understand the economy is misleading in many instances, and otherwise fails to give a complete picture of the economic landscape for the majority of Americans. This misleading data has resulted in policymakers creating and implementing economic policy that is often totally off the mark, to the serious detriment of lower- and middle-income Americans.
LISEP’s initiative to generate better headline data, starting with a new take on unemployment statistics, has already created some eye-opening results by taking into account the economic benefits of a livable-wage, full-time job. Specifically, LISEP has created the concept of True Rate of Unemployment as a more meaningful way to understand unemployment data than the current statistics published by BLS. This concept of true employment – the number of Americans with full-time jobs with earnings above the poverty level – gives us a better understanding of the economic circumstances relevant to the majority of Americans.
The comparison between the unemployment rate, as published by the BLS, and the LISEP True Rate of Unemployment is profound. It suggests a much weaker economy, certainly for lower- and middle-income Americans. And accordingly, begs for policy solutions that may have seemed less pressing otherwise. Furthermore, LISEP has broken down the True Rate of Unemployment for important populations, with some revealing results: Black Americans have a meaningfully higher True Rate of Unemployment than White Americans every month since 1995. Once again, this is an issue begging for a policy solution that would not be revealed based on normally reported government data.
LISEP is hopeful that by not focusing just on quantity, but quality of jobs, these data will give policymakers a better idea of the state of the labor force, and the tools they need to launch economic initiatives aimed at producing full-time, living-wage employment, to the benefit of lower- and middle-income Americans. As the nation moves toward a post-pandemic recovery, the quickest path must involve bolstering the upward economic mobility of this segment of the American workforce, thus closing the wealth gap and creating opportunity for the nation as a whole.1