Gallup Poll says Republican Party is 89% White (White Party= the party of the Vanishing Majority)
From [HERE] Whites accounted for 89% of Republican self-identifiers nationwide in 2012, while accounting for 70% of independents and 60% of Democrats. Over one-fifth of Democrats (22%) were black, while 16% of independents were Hispanic.


These results are based on more than 338,000 interviews conducted as part of Gallup Daily tracking in 2012, and clearly underscore the distinct racial profiles of partisan groups in today's political landscape.
- Republicans are overwhelmingly non-Hispanic white, at a level that is significantly higher than the self-identified white percentage of the national adult population. Just 2% of Republicans are black, and 6% are Hispanic.
- Seventy percent of Americans who identify as independents are white, but independents have the highest representation of Hispanics (16%) of the three groups. Eight percent of independents are blacks.
- Democrats remain a majority white party, but four in 10 Democrats are something other than non-Hispanic white. More than one in five Democrats are black, roughly twice the black representation in the adult population.
Racial and Ethnic Groups Gravitate Toward Different Parties
Looked at differently, these party composition patterns reflect major differences in the way Americans in various racial and ethnic groups identify their political affiliation.
- Almost two-thirds of blacks identify as Democrats, with most of the rest identifying as independents. Only 5% of blacks nationwide identify as Republicans.
- Half of Hispanics identify as independents, although the majority of the rest identify as Democrats. This is despite their high level of approval and strong majority voting support for Democratic President Barack Obama. Relatively few Hispanics (13%) identify as Republicans.
- Whites are the most politically diverse of the three major racial and ethnic segments, with between 26% and 38% identifying with one of the three partisan groups. Whites tilt slightly toward being independents or Republicans rather than Democrats. The large white concentration of Republican identifiers, in short, is caused by a dearth of nonwhites self-identifying with the GOP, rather than a monolithic Republican orientation among whites.

Although Asians and other races make up a small proportion of the U.S. population, the data show that the political pattern they follow is quite similar to that of Hispanics: they are most likely to identify as independents, second-most likely to identify as Democrats, and least likely to identify as Republicans.
Racial Breakdown of Independents and Democrats Has Shifted Most Since 2008
The racial and ethnic composition of the Republican Party today is similar to what it was in 2008, the year when Gallup began its daily tracking. There have been essentially no changes in the percentage of GOP identifiers who are white, black, and Hispanic.
Independents have become more Hispanic since 2008 (and slightly more black), while Democrats have become more black and more Hispanic. Phrased differently, the independent and Democratic segments of the U.S. population are now less white than they were in 2008, reflecting the uptick in the U.S. nonwhite population over these five years.


Implications
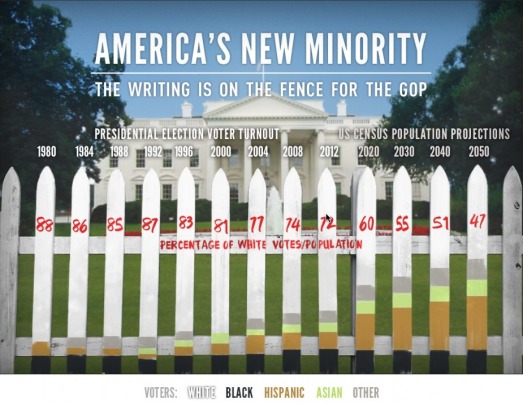
One of the more important realities in American politics today is the substantial divergence in the racial and ethnic composition of the major political parties. Almost nine in 10 Republicans are white, in stark contrast to the racial and ethnic composition of the overall adult population. On the other hand, the Democratic Party is disproportionately nonwhite.
The future of the two major political parties depends on two factors. The first is whether these patterns of party identification change in the years ahead. The ability of the Republican Party to make inroads among nonwhites has been much discussed in recent months, particularly the GOP's efforts to improve on the 13% allegiance that Gallup data show it obtains from Hispanics. Another path to growth for the Republican Party would be an increase in its penetration into the white sector of the population, only 35% of which now identifies as Republican. On the other hand, the Democratic Party will grow if it too can extend its identification among whites, and maintain or strengthen its position among nonwhites.
A second factor that will affect the future of the political parties in the U.S. is straightforward demographics. Projections show that the nonwhite proportion of the American adult population will grow in the years ahead. This means that if current partisan allegiance patterns prevail, the size of the Democratic base will be in a better position to grow than will the Republican base.
Results for this Gallup poll are based on telephone interviews conducted Jan. 2-Dec. 30, 2008, and Jan. 2-Dec. 30, 2012, on the Gallup Daily tracking survey, with a random sample of 353,334 adults, aged 18 and older, living in all 50 U.S. states and the District of Columbia in 2008, and a random sample of 338,703 adults in 2012.
For results based on the total sample of national adults in both 2008 and 2012, one can say with 95% confidence that the margin of sampling error is ±1 percentage point.
Interviews are conducted with respondents on landline telephones and cellular phones, with interviews conducted in Spanish for respondents who are primarily Spanish-speaking. Each sample of national adults includes a minimum quota of 50% cell phone respondents and 50% landline respondents, with additional minimum quotas by region. Landline telephone numbers are chosen at random among listed telephone numbers. Cell phones numbers are selected using random digit dial methods. Landline respondents are chosen at random within each household on the basis of which member had the most recent birthday.
Samples are weighted to correct for unequal selection probability, nonresponse, and double coverage of landline and cell users in the two sampling frames. They are also weighted to match the national demographics of gender, age, race, Hispanic ethnicity, education, region, population density, and phone status (cellphone only/landline only/both, cellphone mostly, and having an unlisted landline number). Demographic weighting targets are based on the March 2012 Current Population Survey figures for the aged 18 and older U.S. population. Phone status targets are based on the July-December 2011 National Health Interview Survey. Population density targets are based on the 2010 census. All reported margins of sampling error include the computed design effects for weighting.
In addition to sampling error, question wording and practical difficulties in conducting surveys can introduce error or bias into the findings of public opinion polls.
For more details on Gallup's polling methodology, visit www.gallup.com.
